How to Achieve a Distinction in a Psychology Dissertation: An In-Depth Guide
Welcome to the Journey of Dissertation Writing
Writing a psychology dissertation can feel overwhelming, but think of it as a journey. Step by step, each phase builds on the last, guiding you to a polished final product. This first section is all about building a strong foundation, setting you up for success later on. Here’s where you’ll clarify your perspective, refine your research question, and learn how to approach your sources critically.
Step 1: Understanding Epistemology—How Do You View Knowledge?
Epistemology might sound intimidating, but it’s simply about how we view knowledge. This is essential in shaping your approach to research, as it determines how you interpret findings and choose your methods. Let’s break it down:
What Is Epistemology?
Epistemology is the philosophical approach to understanding knowledge. When you start your dissertation, it’s crucial to identify how you view the world you’re studying. Do you see it as something objective and measurable, or something subjective and unique to each person’s experience?
Key Epistemological Perspectives
-
Positivism:
-
View: Reality is objective and can be measured.
-
Approach: Typically quantitative, focusing on measurable data to test hypotheses.
-
Example: “Is there a correlation between social media use and self-esteem among teenagers?”
If you’re interested in general trends or measurable outcomes, you might choose a positivist approach, using surveys or experiments to gather numerical data.
-
-
Interpretivism:
-
View: Reality is subjective and constructed by individuals’ experiences.
-
Approach: Typically qualitative, focusing on understanding experiences and perceptions.
-
Example: “How do teenagers describe the impact of social media on their self-esteem?”
Here, you’d use an interpretivist approach, perhaps conducting interviews to explore unique, personal experiences.
-
-
Pragmatism (in Mixed Methods):
-
View: The best approach depends on the research question.
-
Approach: Mixed methods, combining quantitative and qualitative methods as needed.
-
Example: “Is there a correlation between social media use and self-esteem, and how do students explain their experiences?”
Pragmatism is especially useful for complex questions, as it allows you to collect numerical data and then dive deeper with interviews.
-
Why Does Epistemology Matter?
Clarifying your epistemological stance will help you:
-
Choose the right design and methods.
-
Guide your data analysis and interpretation.
-
Structure your writing with a clear perspective, adding depth and focus to your dissertation.
Crafting a Strong, Focused Research Question
Your research question is the backbone of your dissertation. Think of it as the “why” of your study: it guides everything from your methods to your discussion. A strong question is clear, manageable, and aligned with your interests.
Types of Research Questions and Designs
Aligning your question with the right design is essential. Here are some common question types and their ideal designs:
-
Descriptive Questions:
-
Purpose: To describe a phenomenon.
-
Example: “What is the average level of social media use among adolescents aged 15–18?”
-
Design: Descriptive Survey – Collects data on specific characteristics, often using surveys or questionnaires.
-
-
Relational/Correlational Questions:
-
Purpose: To explore relationships between variables.
-
Example: “Is there a relationship between time spent on social media and body image satisfaction?”
-
Design: Correlational Study – Uses statistical tests like Pearson’s correlation to examine relationships.
-
-
Comparative Questions:
-
Purpose: To compare differences between groups.
-
Example: “Do adolescents who limit social media use report higher self-esteem than those who don’t?”
-
Design: Experimental or Quasi-Experimental – Could involve t-tests or ANOVA for group comparisons.
-
-
Exploratory (Qualitative) Questions:
-
Purpose: To understand perspectives or experiences.
-
Example: “How do adolescents describe the impact of social media on their self-esteem?”
-
Design: Phenomenology or Thematic Analysis – Gathers insights through interviews or focus groups.
-
-
Complex (Mixed Methods) Questions:
-
Purpose: To explore both patterns and personal perspectives.
-
Example: “What is the relationship between social media use and self-esteem, and how do adolescents describe this impact?”
-
Design: Mixed Methods (Sequential or Concurrent) – Uses quantitative surveys and qualitative interviews to understand both numbers and experiences.
-
Tip: Choose a question that’s both meaningful to you and manageable within your timeframe. It should spark your curiosity and be specific enough to explore in-depth.
Conducting a Critical Literature Review
The literature review is a foundational part of your dissertation, helping you understand existing research and position your study. But it’s not just about summarising studies; it’s about thinking critically and forming a clear argument.
What Does It Mean to Be Critical?
Being critical involves evaluating and questioning:
-
Assess each study’s strengths and weaknesses. Did the researchers use a large enough sample? Are there biases?
-
Compare findings. Do studies agree, or are there conflicting results? What could explain the differences?
-
Identify gaps. What’s missing in the current research? These gaps will help you justify your study’s purpose.
Structuring Your Literature Review (Using the Funnel Approach)
-
Start Broad: Begin with a broad overview of the topic. For example, if your topic is social media and self-esteem, start with general studies on how social media affects mental health.
-
Organise by Theme: Group studies by themes or variables, such as “social media and self-esteem,” “social media and body image,” and “social media and peer comparison.” Discuss each theme in its own subsection, moving from broader themes to more specific studies related to your question.
-
Focus Narrowly at the End: Conclude by identifying gaps and explaining how your study addresses these gaps. For example, “Few studies have examined how specific types of social media impact body image satisfaction in adolescents, which this study aims to explore.”
Example:
-
Broad Overview: Studies show that social media use is linked to various mental health outcomes, both positive and negative.
-
Themes:
-
Social Media and Self-Esteem: Research indicates that increased social media use correlates with lower self-esteem in some groups.
-
Social Media and Body Image: Comparisons on social media may lead to dissatisfaction with body image.
-
-
Gap and Focus: “Despite the research linking social media and body image, few studies have explored how different platforms affect specific age groups. This study focuses on how Instagram affects body image among adolescents.”
Tip: Use headings for each theme to help keep your literature review organised and easy to follow. This “funnel” approach shows the reader how your study fits within and builds on existing research.
Checklist for a Strong, Critical Literature Review
-
Evaluate each source, noting strengths, limitations, and any biases.
-
Compare studies on similar themes, and highlight any patterns or discrepancies.
-
Identify Gaps in the literature, explaining why your study is needed.
-
Be Objective: Support your critique with evidence rather than personal opinions.
Final Thought: The literature review should build a solid case for your study by showing what’s been done and what still needs to be explored. Think of it as setting the scene for the rest of your dissertation.
Designing and Executing Your Research
In this section, you’ll move from planning to action. We’ll cover:
-
Selecting the Right Methodology
-
Collecting Data with Integrity and Care
-
Analysing Data in Line with Your Research Approach
This part of the guide focuses on executing your study in a structured, effective way. Each step helps ensure that your research methods align with your research question and that your results are presented clearly and objectively.
Selecting the Right Methodology
Your methodology is the heart of your dissertation. This is where you explain your research design, data collection methods, and analysis techniques. Your methodology should align with the research question and epistemology you established in Section 1.
Breaking Down Methodology
-
Quantitative Methodology
-
Purpose: To collect and analyse numerical data that can be quantified, often with the aim of identifying patterns or testing hypotheses.
-
Key Components:
-
Participants: Describe who will take part in the study, including sample size, demographics, and recruitment methods.
-
Design and Procedure: Outline the study’s design (e.g., experimental, correlational) and step-by-step procedures for data collection.
-
Data Analysis: Specify the statistical tests (e.g., t-test, ANOVA, correlation) and software (e.g., SPSS) used.
-
-
Example:
-
Research Question: “Is there a relationship between self-esteem and academic performance among high school students?”
-
Design: Correlational
-
Participants: 200 high school students, aged 15–18.
-
Procedure: Survey participants on self-esteem and collect GPA data.
-
Analysis: Pearson’s correlation to assess the strength and direction of the relationship.
-
-
-
Qualitative Methodology
-
Purpose: To explore perceptions, experiences, and meanings. Qualitative research is usually more flexible, allowing participants to share their views in their own words.
-
Key Components:
-
Participants: Describe the sample, which is typically smaller than in quantitative research. Include details on recruitment and any demographic factors that might influence findings.
-
Data Collection: Outline methods such as interviews, focus groups, or open-ended surveys, and include a script or interview guide if relevant.
-
Data Analysis: Explain the analytical approach (e.g., thematic analysis, grounded theory) and how you plan to identify and interpret patterns in the data.
-
-
Example:
-
Research Question: “How do high school students describe the impact of social media on their self-esteem?”
-
Design: Thematic analysis
-
Participants: 15 high school students selected for variation in age and social media usage.
-
Procedure: Conduct in-depth interviews.
-
Analysis: Code transcripts and identify recurring themes related to self-esteem.
-
-
-
Mixed Methods Methodology
-
Purpose: To use both quantitative and qualitative methods to provide a more comprehensive understanding of the research question.
-
Key Components:
-
Participants: Describe both the quantitative and qualitative sample groups.
-
Data Collection: Explain both phases of data collection, detailing the survey (quantitative) and the interviews or focus groups (qualitative).
-
Data Analysis: Explain how the data will be integrated, comparing numerical findings with qualitative insights.
-
-
Example:
-
Research Question: “What is the relationship between social media use and self-esteem among high school students, and how do students describe this impact?”
-
Design: Sequential explanatory
-
Participants: 200 students for the survey, 15 for interviews.
-
Procedure: Conduct a survey, analyse results, then conduct interviews with selected students to explore results in depth.
-
Analysis: Use statistical methods for survey results, thematic analysis for interview data, then integrate findings.
-
-
Writing Your Methodology Section
-
Epistemology: Start by explaining your epistemological stance, linking it to your choice of qualitative, quantitative, or mixed methods.
-
Participants: Provide details about who took part in the study and how they were chosen.
-
Design and Procedure: Outline the design, step-by-step data collection, and any tools or materials used.
-
Data Analysis: Detail the statistical or thematic analysis methods you plan to use, along with any software.
-
Ethical Considerations: Discuss how you ensured ethical practices, such as informed consent, anonymity, and respect for participants.
Collecting Data with Integrity and Care
Once your methodology is in place, it’s time to collect your data. This phase requires careful planning to ensure your data is reliable and valid. Here’s a roadmap for data collection:
Quantitative Data Collection
-
Plan Ahead: Ensure that all surveys or instruments are standardised and pilot-tested if possible. This reduces the chance of errors.
-
Keep Data Consistent: Maintain consistency in conditions. For example, if you’re administering a survey, ensure participants complete it under similar conditions.
-
Double-Check: Review data entries for accuracy before beginning analysis. Small errors can lead to skewed results.
Qualitative Data Collection
-
Build Rapport: When conducting interviews or focus groups, it’s essential to establish a comfortable environment. This helps participants open up and share deeper insights.
-
Use Open-Ended Prompts: Qualitative data collection relies on open-ended questions that invite participants to share detailed responses. Avoid leading questions.
-
Record and Transcribe: Record interviews (with permission) and transcribe them accurately. Transcripts are essential for accurate data analysis.
Mixed Methods Data Collection
-
Follow Phases Carefully: In mixed methods, ensure you complete each phase fully before moving to the next. For example, if conducting a sequential design, complete and analyse quantitative data before beginning qualitative data collection.
-
Integrate Thoughtfully: If collecting data simultaneously, keep track of how both types of data will eventually be compared and integrated.
Tip: Document each step of your data collection carefully. Include dates, sample characteristics, and any variations in conditions. This transparency adds credibility to your study.
Analysing Data in Line with Your Research Approach
Data analysis is where you interpret your results, identifying patterns, relationships, or themes. The approach to analysis differs significantly between quantitative and qualitative research.
Quantitative Data Analysis
Quantitative analysis involves statistical methods to examine patterns and test hypotheses.
-
Descriptive Statistics: Start by calculating basic statistics, such as mean, median, and standard deviation. This helps you summarise your data.
-
Inferential Statistics:
-
T-Tests: Use these to compare two groups on a single outcome. For example, comparing self-esteem scores between two groups.
-
ANOVA: Use this to compare three or more groups. For example, examining differences in self-esteem among students from different schools.
-
Correlation: Measures the strength and direction of a relationship between two variables.
-
Regression: Tests if one variable can predict another. For example, examining if social media use can predict levels of self-esteem.
-
-
Reporting in APA Style:
-
Use APA-style tables to display your results, including means, standard deviations, and p-values.
-
Provide a brief interpretation for each statistic. For example, “A significant negative correlation was found between social media use and self-esteem (r = -0.45, p < .01), suggesting that higher social media use is associated with lower self-esteem.”
-
Qualitative Data Analysis
Qualitative analysis involves interpreting themes and patterns within textual data.
-
Coding: Start by reading through transcripts or responses, identifying keywords or recurring ideas. Coding helps organise data into manageable themes.
-
Thematic Analysis: Organise your codes into larger themes. For example, themes like “social comparison” and “peer pressure” might emerge in a study on social media and body image.
-
Writing Up Findings: Describe each theme in detail, using quotes from participants to support your interpretation. This adds depth and demonstrates the meaning behind each theme.
-
Using Software: Consider using software like NVivo or ATLAS.ti to help organise and code qualitative data, making it easier to identify and track themes.
Mixed Methods Data Analysis
In mixed methods, you’ll analyse quantitative and qualitative data separately before integrating them.
-
Analyse Quantitative and Qualitative Data Independently: Begin with statistical analysis for quantitative data, then use coding and thematic analysis for qualitative data.
-
Integration:
-
Sequential Design: Use qualitative findings to explain patterns from quantitative data. For instance, if a survey shows a strong correlation between social media use and low self-esteem, interviews might reveal that students feel pressured to compare themselves to influencers.
-
Concurrent Design: Compare findings from both data types to look for consistencies or contradictions.
-
-
Writing Up Mixed Methods Results: Clearly distinguish between quantitative and qualitative findings, then discuss how they relate to each other. For example, “Survey results showed a significant relationship between social media and self-esteem, which was further explained in interviews where students discussed feelings of comparison and inadequacy.”
Tip: Keep your data analysis section clear and focused. Only include the most relevant results, summarising details and using visuals when helpful. Place extensive data (like full transcripts or SPSS outputs) in the appendix to keep your main analysis clean and concise.
Writing and Presenting Your Findings
Congratulations! You’ve completed your data collection and analysis—now it’s time to bring everything together in the final sections of your dissertation. This last part focuses on presenting and interpreting your findings, and wrapping up with a strong conclusion. We’ll cover:
-
Presenting Results Clearly and Objectively
-
Interpreting and Discussing Findings Critically
-
Writing a Cohesive Conclusion
-
Formatting in APA Style and Finalising Your Dissertation
This section is all about clear, professional communication, ensuring your work shines and conveys the value of your research.
Presenting Results Clearly and Objectively
The results section is where you report your findings without any interpretation—think of it as displaying your data in its raw form.
Structuring the Results Section
-
Overview of Findings:
-
Start with a brief summary of the key findings. This helps readers understand the big picture before diving into specific results.
-
-
Quantitative Results:
-
Descriptive Statistics: Present means, medians, standard deviations, and any relevant descriptive stats.
-
Inferential Statistics: Report any statistical tests you conducted (e.g., t-tests, ANOVA, correlation).
-
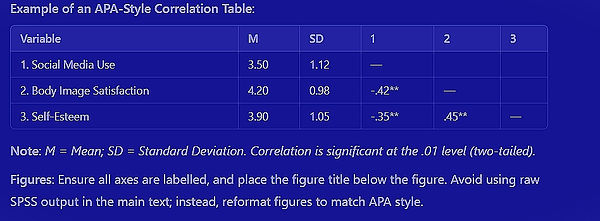
APA Style for Tables and Figures: Use APA-style tables to display results, following these guidelines:
-
Tables: Include a table title, and present only horizontal lines. For example:
-
-
-
-
-
Figures: For charts or graphs, label axes, and include a clear figure title below. Use visuals sparingly and only to enhance understanding.
-
-
Interpreting Significance: Mention p-values and confidence intervals, but leave interpretation for the Discussion section.
-
-
Qualitative Results:
-
Themes and Subthemes: List each main theme that emerged from your analysis, with sub-themes if needed.
-
Supporting Quotes: Use participants’ quotes to illustrate each theme. For example, if your theme is “peer comparison,” include quotes that reflect this, such as, “I feel like I’m always comparing myself to others on Instagram.”
-
Structure: Introduce each theme briefly, then present quotes and a summary.
-
-
Mixed Methods Results:
-
Separate Reporting: Start with quantitative results, then qualitative.
-
Integration: Conclude with a section comparing or integrating both sets of results. For instance, if survey data show a link between social media use and low self-esteem, qualitative data might reveal why students feel this way (e.g., due to comparisons with influencers).
-
Key Tips
-
Be concise and objective; avoid interpreting findings here.
-
Label all tables and figures clearly.
-
Keep the main text focused and place full datasets (e.g., SPSS outputs) in the appendix.
Interpreting and Discussing Findings Critically
The discussion is the heart of your dissertation. This is where you interpret your findings, relate them to your research question, compare them with previous literature, and offer your insights.
Structure of the Discussion
-
Restate Key Findings:
-
Briefly summarise the main findings from your results section. This serves as a transition into the interpretation phase.
-
-
Interpreting Results:
-
Explain what your findings mean in the context of your research question. For example, if you found a significant negative correlation between social media use and self-esteem, discuss what this suggests about social media’s impact on self-perception.
-
Link Back to Epistemology: If you used an interpretivist approach, mention that your findings reflect personal experiences. If you used a positivist approach, emphasise the generalisability of your data.
-
-
Comparing with Existing Literature:
-
Discuss how your findings align or contrast with previous studies you covered in your literature review. Highlight any similarities, contradictions, or new insights.
-
Example: “While Smith et al. (2020) found no significant link between social media and self-esteem, our study suggests a moderate negative correlation, perhaps due to differences in sample demographics.”
-
-
Being Critical:
-
What Does Being Critical Mean? Being critical means evaluating your findings honestly and thoughtfully, considering their limitations, strengths, and implications.
-
A Good Critical Analysis:
-
Acknowledges Limitations: Discuss potential weaknesses, like small sample size or potential biases, and how these might impact results.
-
Considers Alternative Explanations: If there are alternative ways to interpret your data, mention them. This demonstrates a balanced perspective.
-
Explores Practical Implications: Discuss any real-world implications. For instance, “These findings suggest that schools should promote media literacy to mitigate social comparison effects.”
-
-
-
Identifying Limitations:
-
Every study has limitations, and acknowledging them adds credibility to your work.
-
Common Limitations:
-
Sample size limitations
-
Generalisability of findings
-
Potential biases in data collection or interpretation
-
-
-
Suggestions for Future Research:
-
Offer recommendations for future studies. For example, “Future research could explore these findings in different cultural contexts or with longitudinal data.”
-
If certain variables were beyond your scope but relevant to your findings, suggest these for further exploration.
-
Writing a Cohesive Conclusion
The conclusion is your opportunity to summarise and reinforce the main points of your study. It should be concise, memorable, and impactful.
Structure of the Conclusion
-
Recap of Key Findings:
-
Summarise the most important findings in one or two sentences.
-
-
Answer the Research Question:
-
Directly address your research question, summarising how your findings provide an answer.
-
-
Highlight the Study’s Contribution:
-
Explain the value of your study and what it contributes to the field.
-
For example, “This study adds to the literature by highlighting how social media can impact self-esteem among adolescents, emphasising the need for targeted interventions.”
-
-
Final Thoughts or Takeaways:
-
Offer a closing thought, which could be a statement on the broader implications of your research or a call for awareness or action.
-
-
Avoid Introducing New Information:
-
The conclusion is for summarising, not for adding new analysis or findings. Stick to what’s already been discussed.
-
Formatting in APA Style and Finalising Your Dissertation
Adhering to APA style makes your dissertation look professional and ensures consistency. Here’s a checklist for final formatting and proofreading.
APA Formatting Checklist
-
In-Text Citations and Reference List:
-
Ensure every source cited in-text has a corresponding entry in the reference list.
-
Format citations and references in APA style, including author names, publication year, and titles.
-
-
Tables and Figures:
-
Follow APA guidelines for tables (e.g., title above the table, only horizontal lines).
-
Label each figure, and place the title below.
-
-
Headings and Subheadings:
-
Use APA-style headings to organise sections and subsections, maintaining a hierarchy for easy reading.
-
-
Appendices:
-
Place supplementary materials like raw data, full transcripts, or survey instruments in the appendix.
-
Label each appendix clearly (e.g., Appendix A: Survey Instrument).
-
Proofreading and Polishing
-
Check for Consistency: Ensure your terminology, tense, and style are consistent throughout.
-
Eliminate Redundant Words: Aim for clarity and conciseness.
-
Run a Grammar Check: Tools like Grammarly can help catch minor errors.
-
Seek Feedback: If possible, ask a peer or mentor to review your work for clarity and coherence.
Final Checklist Before Submission
-
Abstract: Provides a clear summary of the research question, methods, results, and conclusions.
-
Introduction: Sets the stage, introduces the research question, and provides an outline.
-
Literature Review: Covers relevant research, critiques studies, and identifies gaps.
-
Methodology: Clearly describes participants, procedures, and data analysis methods.
-
Results: Presents findings objectively with APA-style tables and figures.
-
Discussion: Interprets findings, compares with literature, acknowledges limitations, and suggests future research.
-
Conclusion: Recaps the study’s key points and contributions.
-
References: Complete and formatted in APA style.
-
Appendices: Includes supplementary materials, labelled and organised.
Final Thoughts: Wrapping Up Your Dissertation Journey
Writing a distinction-level psychology dissertation is challenging, but by following this structured approach, you’ve built a well-rounded, professional study. Each section contributes to the larger story, from setting the foundation with a clear research question and epistemology, to analysing your findings critically, to presenting a cohesive conclusion. Remember that your dissertation is a significant contribution to psychology, one that demonstrates not just your knowledge, but also your ability to think critically, analyse carefully, and communicate effectively. Good luck, and congratulations on completing this journey!